


Imagine this scenario: You are sitting in a meeting with your client, discussing the results of their SEO efforts. Numbers and data are being thrown around, but it's hard to make sense of it all. You know your team has put in a lot of hard work and effort, but how can you effectively communicate that to your client? The answer lies in data visualization.
In today's digital age, businesses are bombarded with an overwhelming amount of data. From website analytics to social media engagement, there is no shortage of numbers to sift through. However, the challenge lies in making sense of this data and using it to drive actionable insights. This is where the power of data visualization comes into play.
What is Data Visualization?
Simply put, data visualization is the graphical representation of data or information. It uses visual elements such as charts, graphs, and maps to help people understand complex information quickly and easily. By presenting information visually, it becomes easier for our brains to process and interpret.
Why Use Data Visualization for SEO Reports?
When it comes to SEO reports, traditional methods such as spreadsheets or written reports can be overwhelming and difficult for clients to understand. In contrast, visual analytics can transform these reports into powerful tools that effectively communicate key metrics and insights.
1. Simplify Complex Information
SEO involves a plethora of technical jargon and metrics that may be unfamiliar to clients. Using visual aids such as charts or infographics can help break down these concepts into digestible pieces that anyone can understand.
For example, instead of presenting a client with a list of keywords they have been targeting along with their rankings over time, you could use a line graph that shows the progress over time in a more visually appealing way.
2. Identify Trends at a Glance
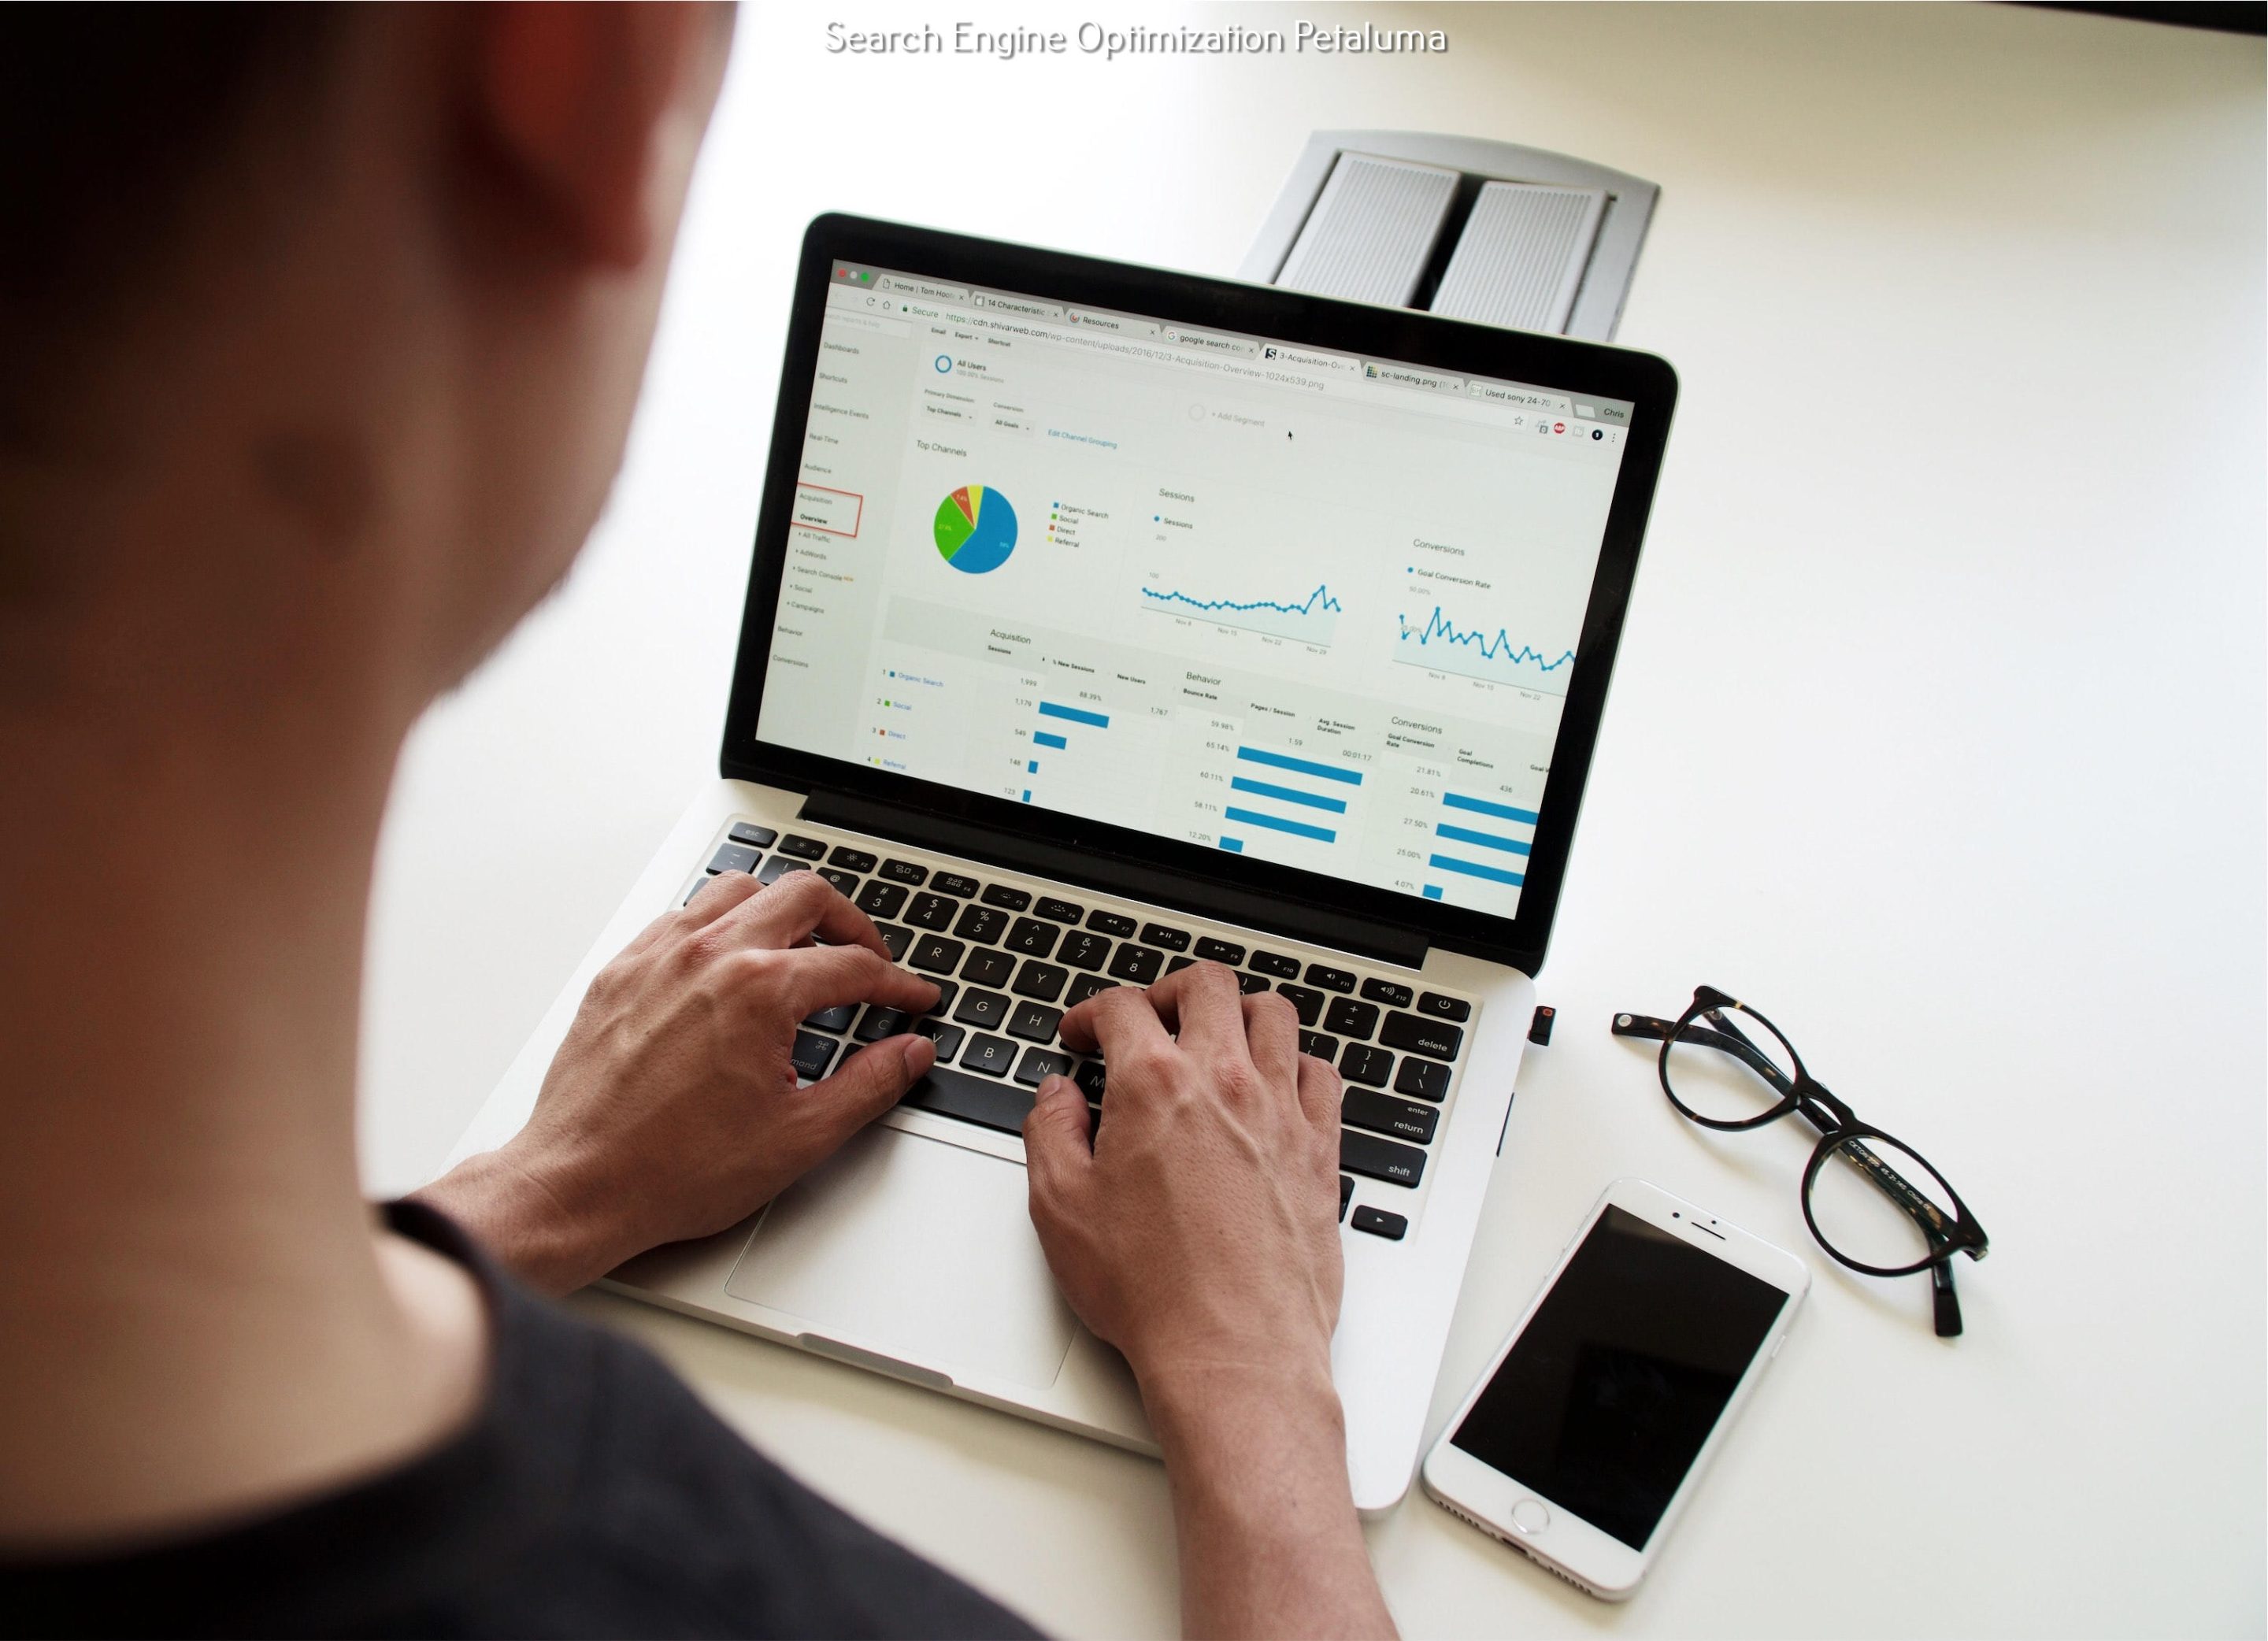
One of the most significant advantages of using visual analytics is its ability to identify trends quickly. With traditional methods like spreadsheets or written reports, it may take some time to analyze the data and spot patterns. Visual aids, on the other hand, allow for a quick overview of data, making it easier to identify trends and patterns.
For instance, a bar graph can effectively illustrate which channels are driving the most traffic to a website or which keywords are performing well.
3. Enhance Communication
In today's fast-paced business world, time is of the essence. Clients may not have the luxury of sitting through lengthy reports or presentations. Visual aids can help you communicate your insights quickly and concisely.
For example, instead of explaining the impact of a recent algorithm update with words, you could use an infographic that visually shows how it affected website traffic and rankings.
4. Make Data More Memorable
The human brain processes images 60,000 times faster than text. This means that visual aids are not only more efficient in communicating information but also more memorable. By using charts or graphs in your SEO reports, you are providing clients with something they can easily recall when discussing their website's performance.
5. Encourage Actionable Insights
The ultimate goal of any SEO report is to drive actionable insights that will improve a website's performance. Visual analytics helps to highlight key metrics and trends that require attention and action from clients.
For instance, if there is a significant drop in website traffic from mobile devices shown on an infographic, this could prompt clients to focus on optimizing their site for mobile users.
How Can You Incorporate Data Visualization into Your SEO Reports?
There are various tools available that make it easy to incorporate data visualization into your SEO reports. Google Data Studio is one such tool that allows you to create interactive dashboards using data from multiple sources like Google Analytics or Search Console.
Another popular option is Tableau, which offers advanced data visualization capabilities for businesses with more complex reporting needs.
Conclusion
In conclusion (pun intended), data visualization has become an essential element in modern-day marketing strategies. It not only simplifies complex information but also makes it more memorable and actionable. By incorporating visual analytics into your SEO reports, you can effectively communicate the success of your efforts and highlight areas for improvement to clients. So don't just throw numbers and data at your clients; use the power of data visualization to tell a compelling story that drives results.

0 Comments